

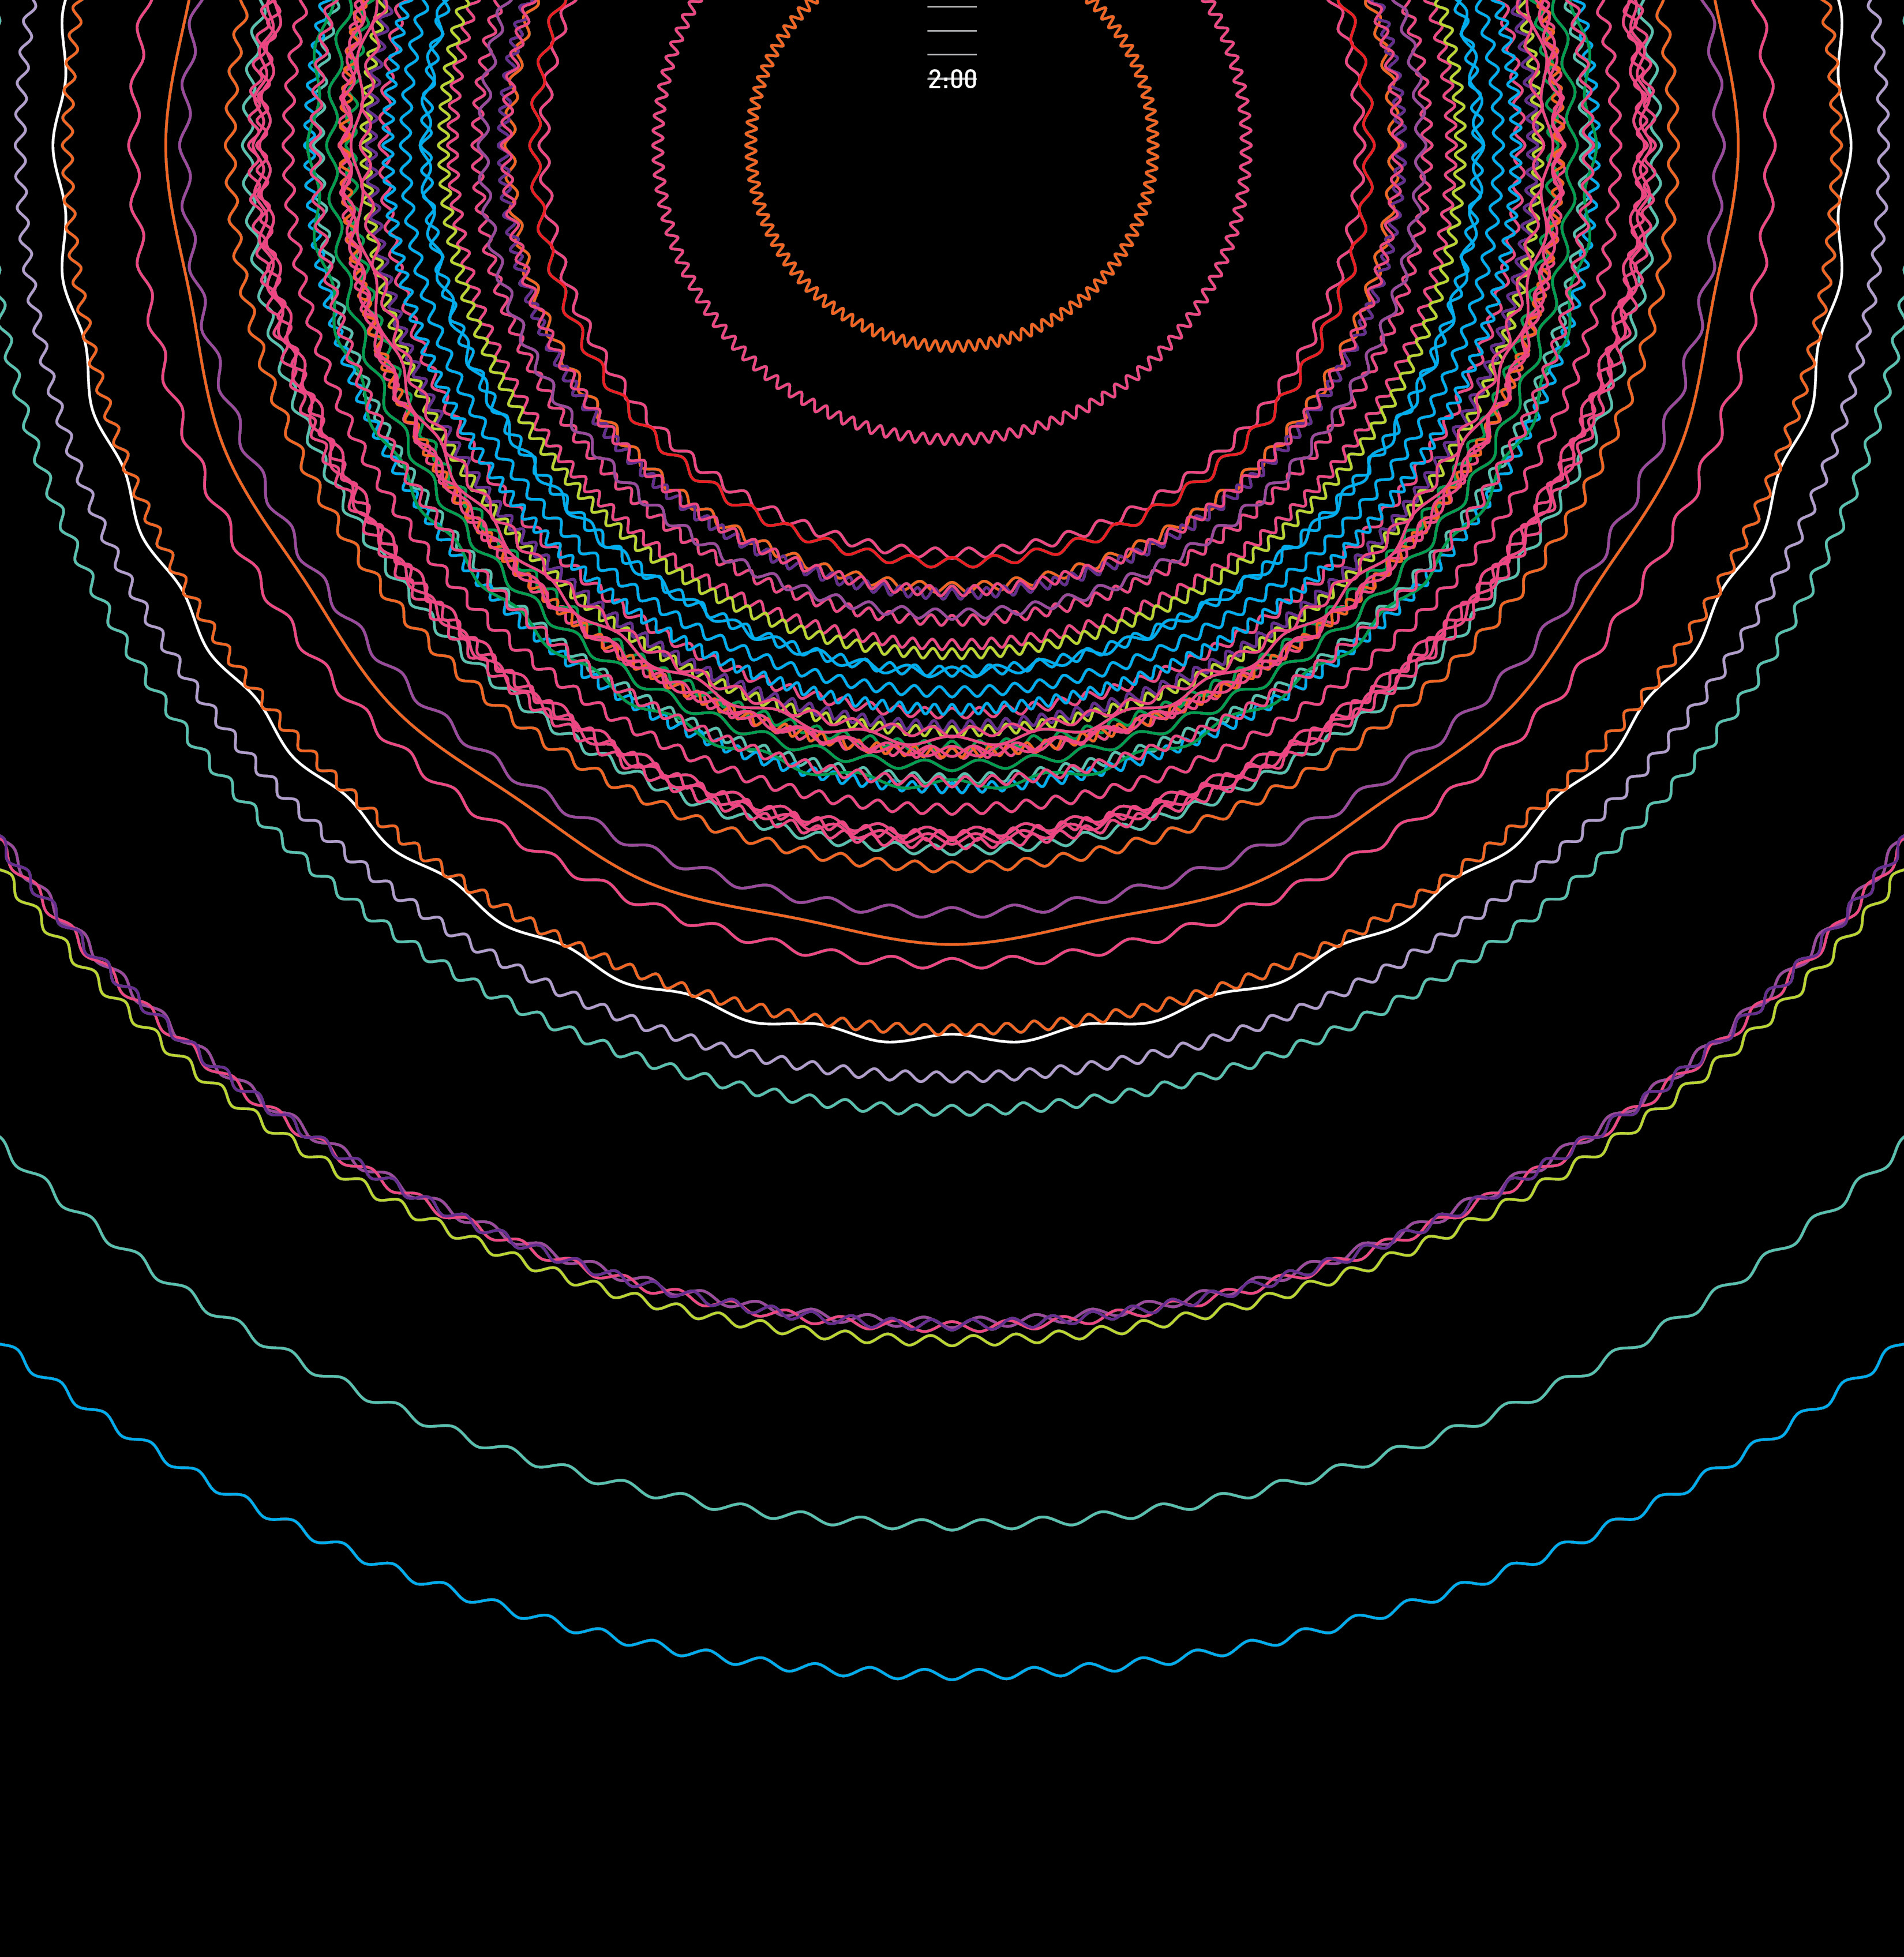

50 Years of Music: Data Visualization Poster of Billboard’s Year End Song from 1967 to 2017.
Each ring represents all 50 top songs, where the color shows the genre, diameter depicts the duration, and the density of wave represents the beats per minute (BPM) of the song. There’s also an interactive component where the user can experience the history of each song, the .gif shown is a quick timelapse of the first few songs (sans music).